Here’s a really useful prompt you can use in the new ServiceM8 AI-powered reporting suite…
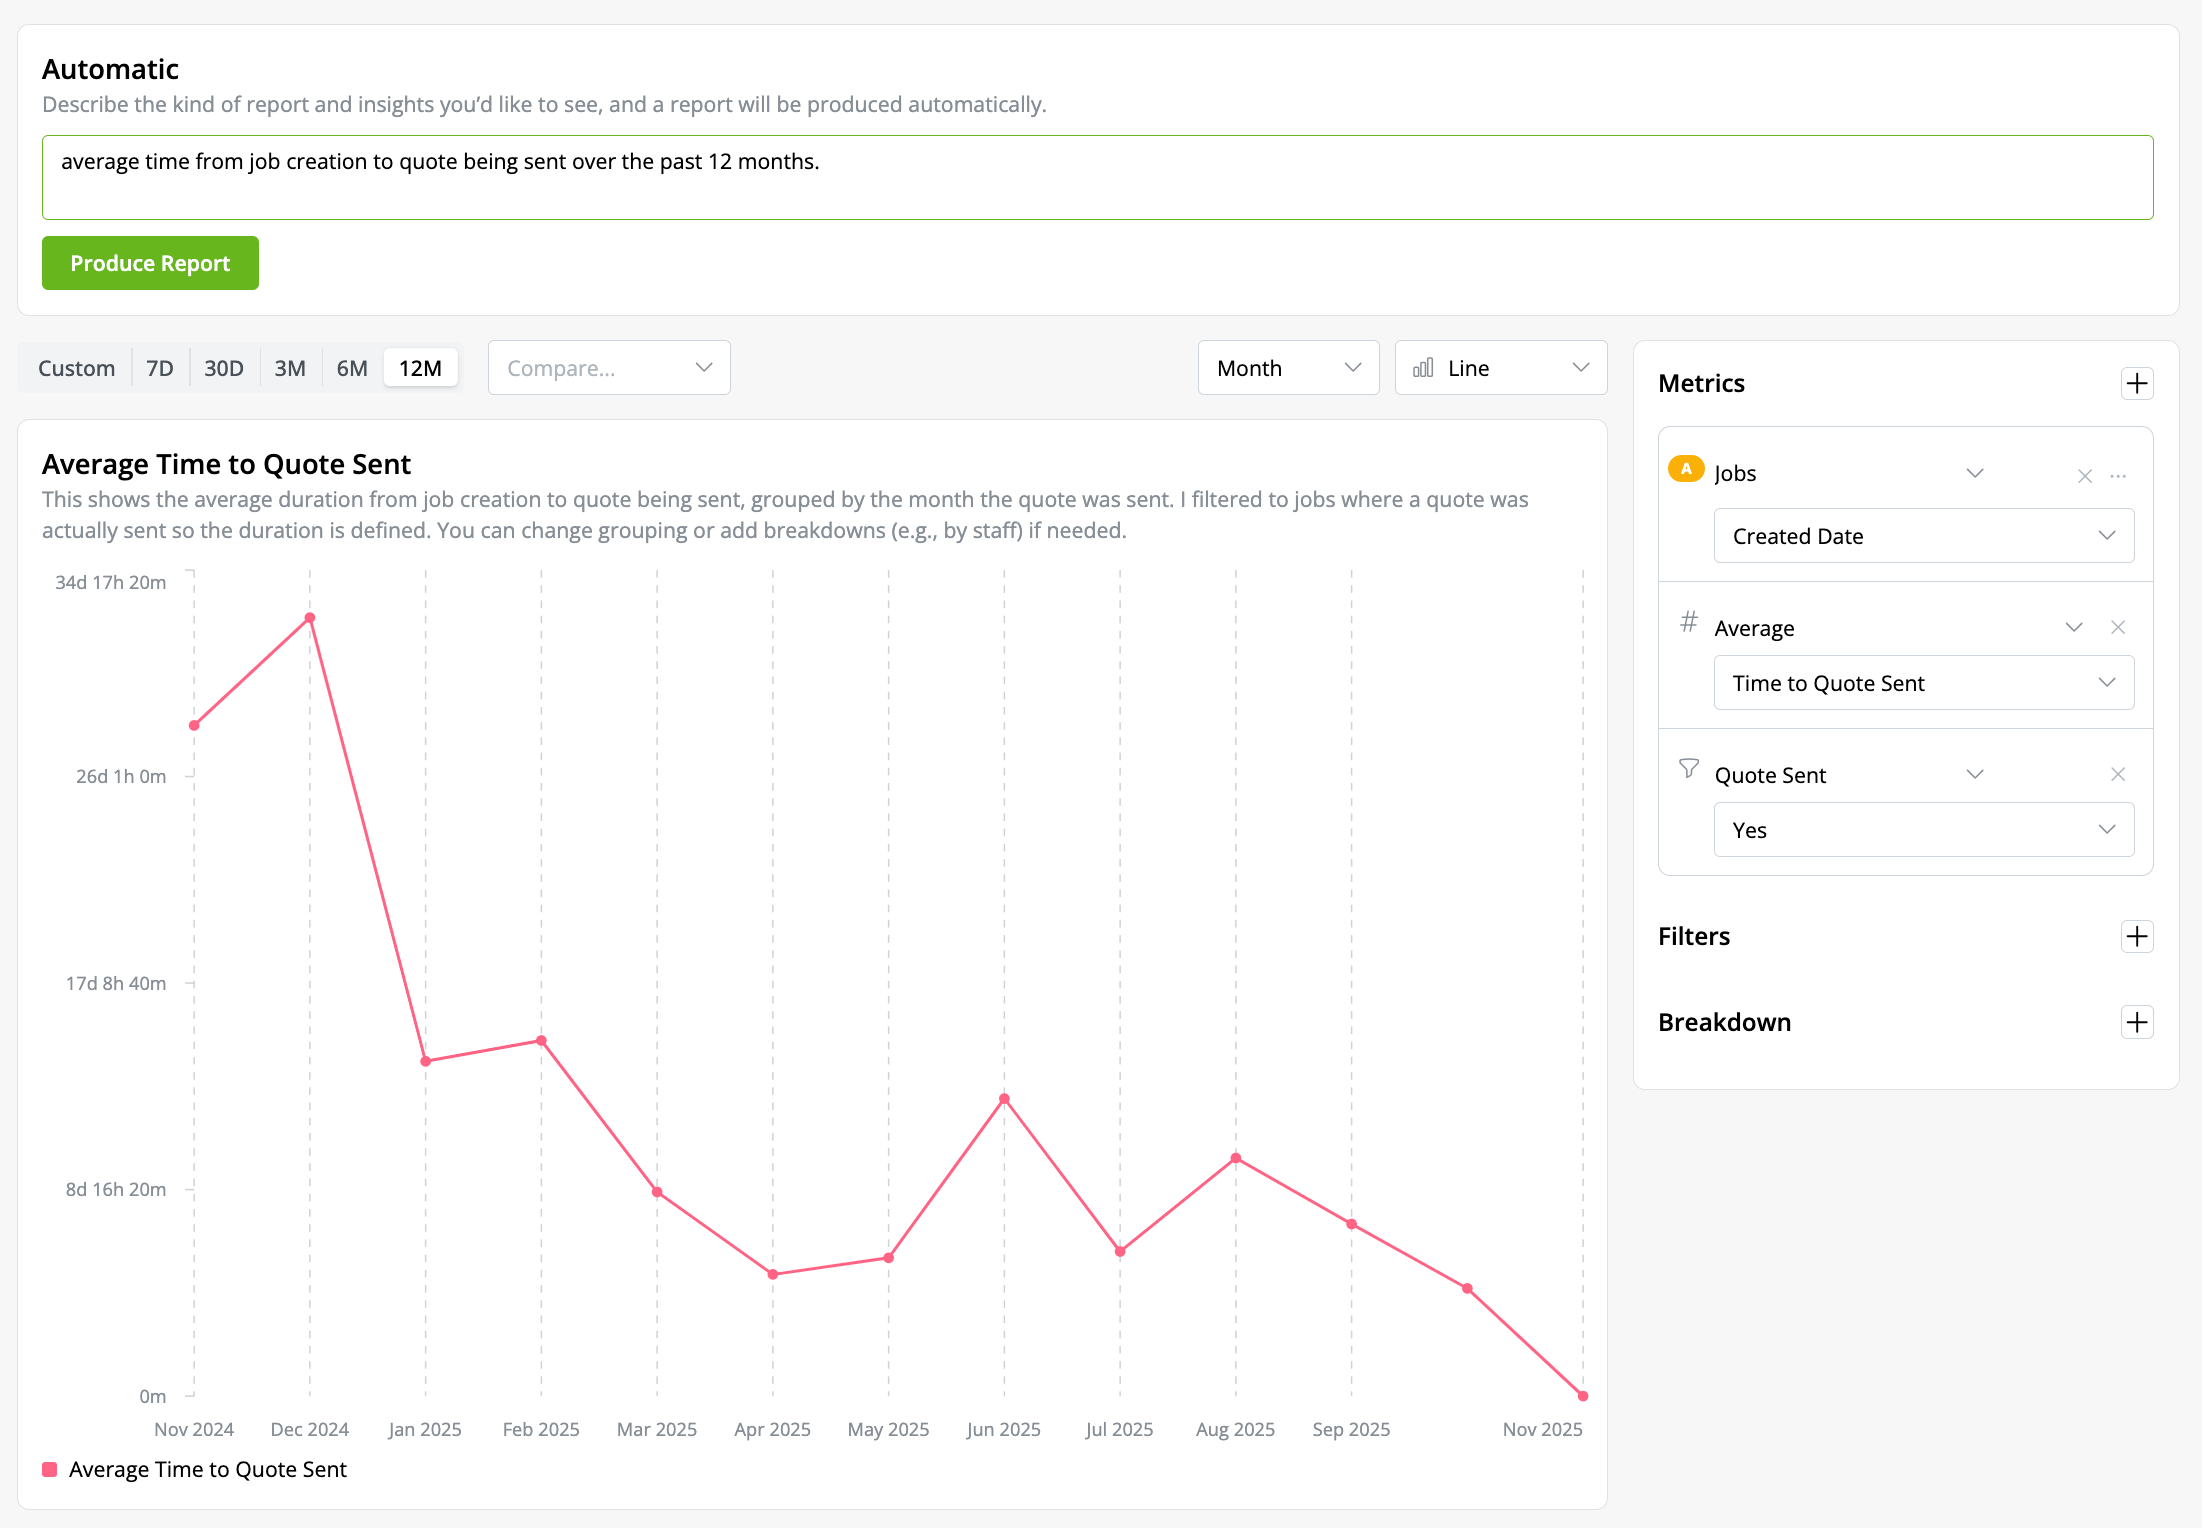
“Average time from job creation to quote being sent over the past 12 months”
You want a graph line that’s trending downward to show that you’re getting quotes & proposals out faster.
Use the save report button on the right hand side to save the report – this will allow you to check your progress regularly.
What does your graph look like?
